Hi,
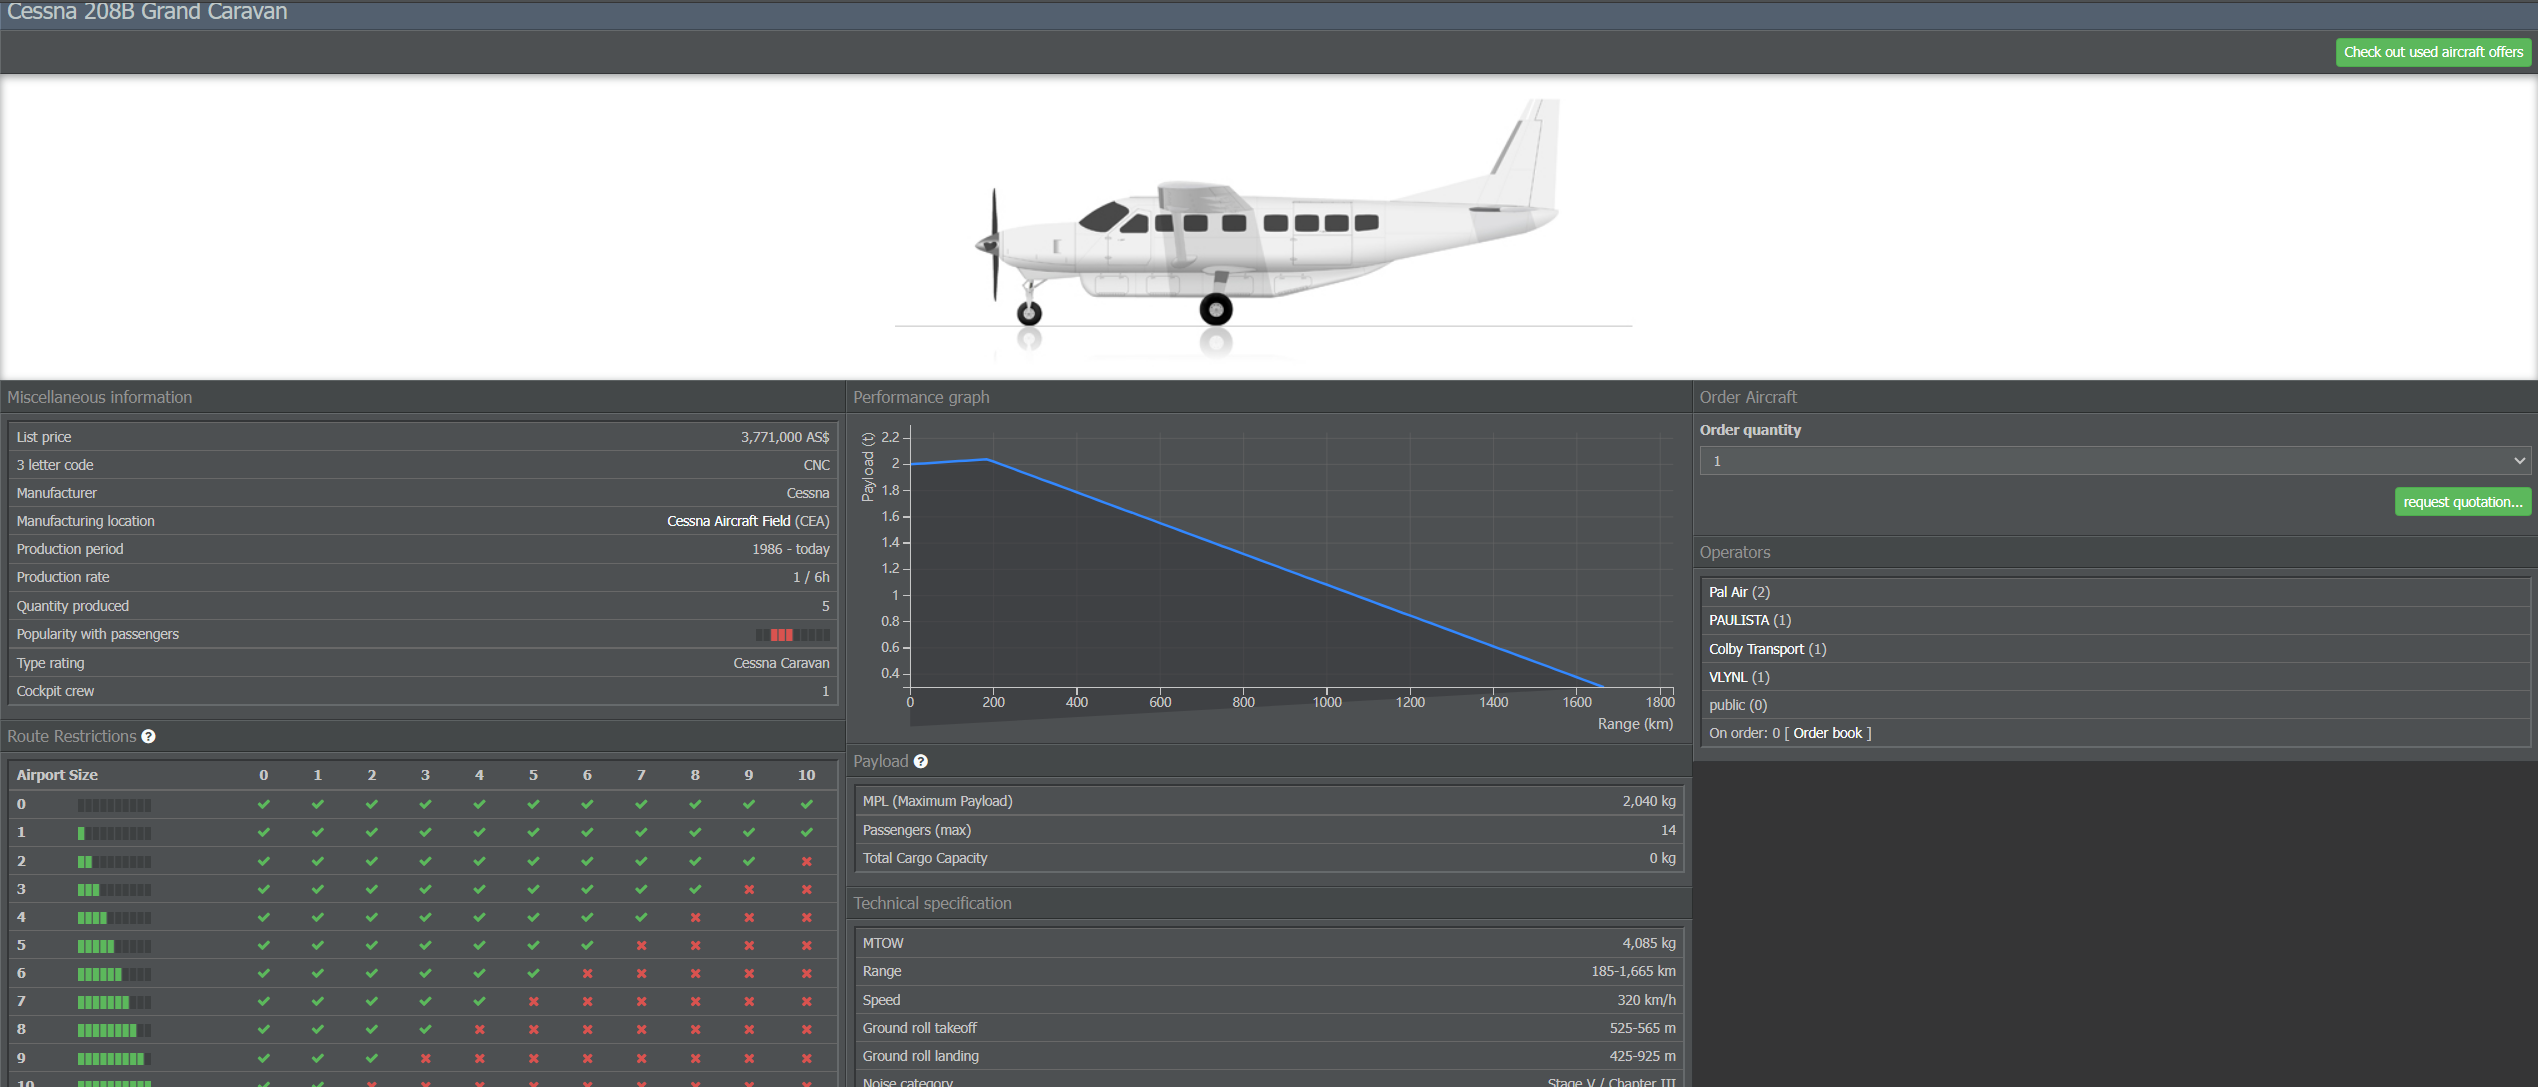
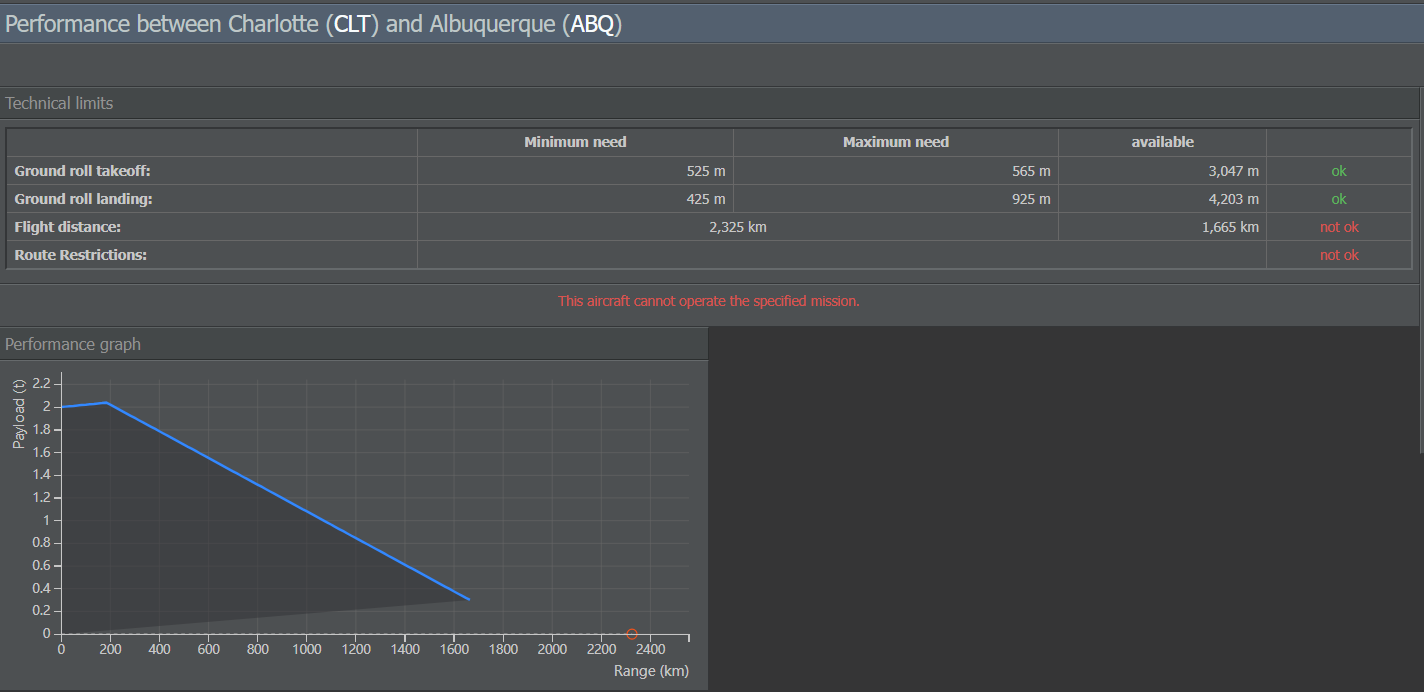
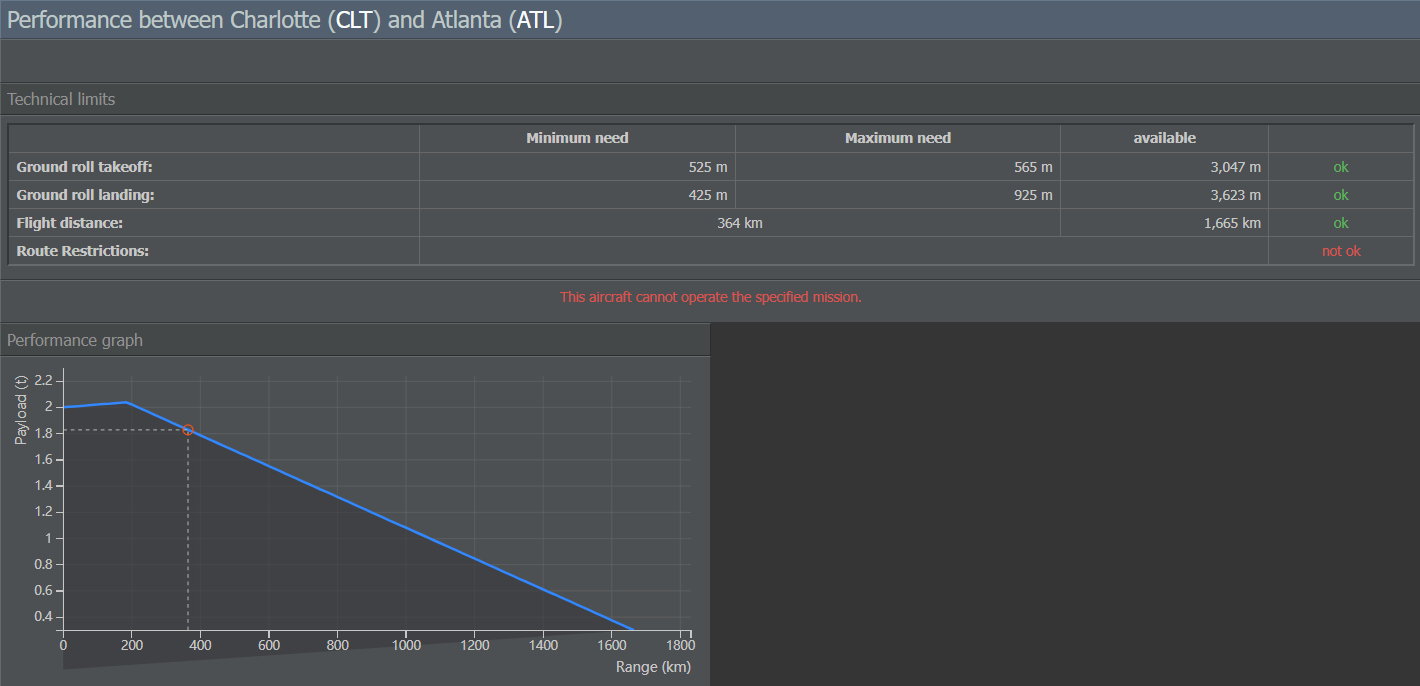
It seems like there is a glitch on the performance chart for all the Cessna 208 models. As you can see the shadow area extends to the negative half of the payload axis. This happens for all the Cessna 208 models. Not sure if it’s just a graphic glitch or actual data glitch tho.
Looked into it and suspected a data issue. Said issue was right there in front of my eyes, but I didn’t spot it because it was so unintuitive. Our data for the Cessna 208s has identical values for “range 2” and “range 3”. This means the math for the “third sector” of a typical performance graph never gets computed and the minimum possible payload is whatever is in the specs for range 2 (because either the distance is lower than or equal range 2 or it’s higher than range 3 in which case no payload calculation takes place to begin with).
The chart renderer just didn’t expect this case and always calibrates for a payload of zero at range 3, hence the dip into negative values on the y-axis.
Either way, this is a data issue and we’ll look into it.